
Image types: How To Differentiate Life Science Images
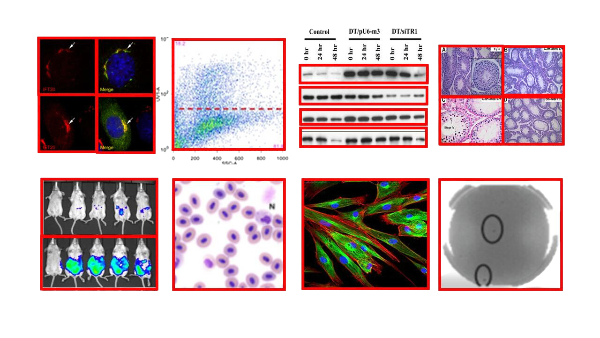
In the realm of life science research, images play a pivotal role in conveying complex information in an understandable way. From microscopy to immunohistochemistry, life science images capture data that can’t always be conveyed by words. This blog post will delve into the diversity of image types used in life science research and publications, providing a comprehensive explanation of how life science images are generated, the tools used to create them, and the unique information they add to research.
Microscopy Images: A Cornerstone of Life Science Images
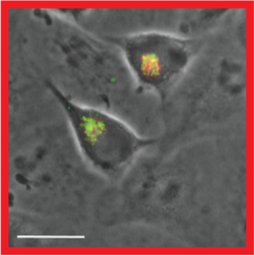
Microscopy images are a fundamental part of life science research. They are generated using various types of microscopes, such as light microscopes, electron microscopes, and confocal microscopes, each providing a different perspective and level of detail. These images provide a close-up view of biological structures, helping researchers understand their function and behavior. One of the inherent challenges in microscopy is the difficulty in avoiding the capture of areas with overlap, especially when trying to photograph all sample areas and when changing lens magnifications. This overlap can lead to image duplications and to potential misinterpretations.
When using microscopy images, authors should ensure that the images are clear and well-focused. It’s also important to correctly label the images and provide appropriate scale bars. Lastly, misinterpretation can often be avoided by providing sufficient context and explanation in the figure legend.
Western Blot Images
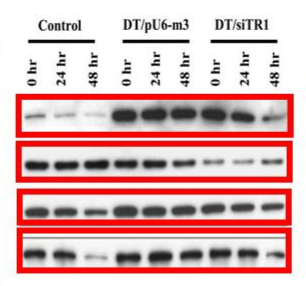
Western blotting is a widely used technique in molecular biology for detecting specific proteins in a sample. The images generated from this technique, known as western blot images, provide information about the protein’s size and the relative amount of it present in the sample.
In western blotting, it’s essential to properly label each sample. Given that the image is produced on a transparent film, marking in a manner that clearly indicates orientation is crucial. This is especially vital to avoiding accidentally flipping the samples, which could result in significant errors, duplications, or misinterpretations and potentially flawed conclusions.
Authors should ensure that the bands are clear and distinct. Over- or underexposure can lead to inaccurate interpretation of the results. Proper controls and having a distinct control for each experiment are a must, and every step should be taken to maintain the integrity and clarity of the results to avoid any possible confusion.
Flow Cytometry Images
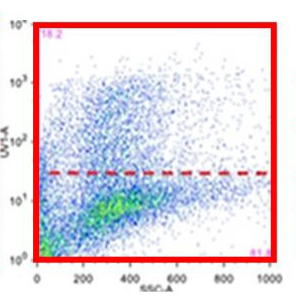
Flow cytometry is a technique used to measure physical and chemical characteristics of cells or particles. The images generated from flow cytometry, which often appear in the form of plots or histograms, provide information about cell size, granularity, and fluorescence intensity.
In flow cytometry, it’s vital to meticulously record each sample. Precise documentation ensures consistency and reproducibility, which are cornerstones of scientific integrity. Any discrepancies or ambiguities in labeling can lead to misinterpretations, potentially compromising the validity of the research.
Authors should ensure that the gating strategy is clearly explained and that any population comparisons are statistically valid. The proper inclusion of all relevant controls in the experiment is also crucial for providing necessary reference points and benchmarks for data interpretation.
Fluorescence Images
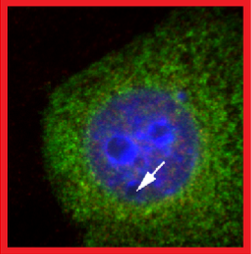
Fluorescence imaging is a technique that uses fluorescence to generate images. This method is widely used in life science research to study the location and movement of specific molecules within cells or tissues.
When using fluorescence images, authors should ensure that the images are not overexposed, as this can lead to loss of detail. It’s also important to correctly interpret the fluorescence signals and provide appropriate controls to validate the results.
Immunohistochemistry Images
Immunohistochemistry (IHC) is a technique used to visualize the distribution and localization of specific cellular components within a tissue. The images generated from IHC provide information about the location and intensity of the target antigen within the tissue.
Authors should ensure that the staining is specific and that any non-specific staining is appropriately controlled for. It’s also important to provide a scale bar and to clearly label the tissue type and the target antigen.
In Vivo and In Vitro Images
In vivo and in vitro images are generated from experiments conducted within or outside of a living organism respectively. These images provide a wealth of information about biological processes, disease progression, and the effects of various treatments.
Authors should ensure that any alterations to images, including adjustments to brightness or contrast, should be uniformly applied across all images within a figure panel to maintain consistency. Crucially, these changes should not distort or alter potential interpretations of the data. Additionally, it is vital to include appropriate controls and to label the images clearly.
Conclusion
In conclusion, understanding the diversity of life science image types and their appropriate usage is critical to effective research and publication. By recognizing the unique demands of life science images, researchers can uphold clarity and authenticity throughout their publications.
Tip
In life sciences, when we talk about diversity in images, it’s not just an aesthetic term. An image serves as the visual embodiment of your research, symbolizing its integrity. Ensure that your images are well-labelled, accurately represent your data and are devoid of any modifications or repetitions. To ensure their authenticity, utilize automated tools like Proofig AI.
Frequently asked questions
Is Proofig AI only for Western blots, or can it check microscopy and flow cytometry images too?
No: Proofig AI checks a wide range of scientific image types, from microscopy, Western blots and FACS to graphs, charts and plots. That covers confocal, light and electron microscopy, gels, in-vivo and in-vitro images, plants and plates, in any scientific field. Each figure is screened for duplication and reuse, manipulation and image plagiarism, and AI-generated image detection covers six categories: microscopy, histology, cell plates, animal imaging, medical scans, and Western blots and gels. Results arrive in minutes, and you decide which findings go into the report.
Why can overlapping microscopy fields show up as duplications in Proofig AI?
Neighboring microscopy fields often capture the same region twice, and Proofig AI detects reuse even when two images only partially overlap. Proofig AI also catches copies that were resized, rotated, flipped or cropped, so a region repeated across panels can be flagged even when one panel was scaled to fit. Proofig AI analyzes confocal, light and electron microscopy. An overlap flag may simply reflect how the fields were captured, so authors review it in context with the forensic tools and replace or explain the panel before submission.
Does Proofig AI check flow cytometry plots and histograms for reuse?
Yes: Proofig AI analyzes FACS (flow cytometry) images and screens plots, graphs, charts and diagrams for duplication and reuse across the whole manuscript. Flow cytometry results usually appear as plots or histograms, and a plot repeated for two different samples is hard to spot by eye. Proofig AI catches copies that were resized or cropped and also compares plots with the industry’s largest image-plagiarism database, with more than 155 million PubMed Open Source Database images. Authors confirm each flag against their sample records.
How can a lab avoid reusing a flipped Western blot image by mistake?
Mark each blot’s orientation clearly, then check the assembled manuscript with Proofig AI, which detects reuse even when a copy is flipped. A blot image produced on transparent film is easy to reverse by accident, and the reversed copy can end up in two panels. Proofig AI analyzes Western blots and gels and also finds reused copies that were rotated, resized or cropped, with results in minutes. The team then reviews each match in context before submission.